I have a number of sites still running Exchange 2010 and because of the buggy management pack there is often not a way to alert on the drive space of an exchange server mount point because sites have removed the management pack.
In searching for a solution, I came across a nice article that helped get me started here:
http://www.powershellneedfulthings.com/?p=36
I took that script and added some additional information so that I could generate both an error condition on low drive space as well as a recovery alert so SCOM knew when to close the alert itself.
In order for this script to run cleanly, you first need to run the following powershell command on any server you want to run mout-point checks on:
new-eventlog
-LogName System -Source OpsHealthScript
Next, schedule the following script to run periodically on your server via task scheduler or whatever program you might use to run scripts on a recurring basis.
$TotalGB = @{Name="Capacity(GB)";expression={[math]::round(($_.Capacity/ 1073741824),2)}}
$FreeGB = @{Name="FreeSpace(GB)";expression={[math]::round(($_.FreeSpace / 1073741824),2)}}
$FreePerc = @{Name="Free(%)";expression={[math]::round(((($_.FreeSpace / 1073741824)/($_.Capacity / 1073741824)) * 100),0)}}
$Check = @{Name="Failed";expression={[math]::round(((($_.FreeSpace / 1073741824)/($_.Capacity / 1073741824)) * 100),0) -lt 10}}
function get-mountpoints {
$global:volumes = Get-WmiObject -computer $server win32_volume | Where-object {$_.DriveLetter -eq $null}
$global:volumes | Select SystemName, Label, Capacity, FreeSpace, $Check | Format-Table -AutoSize
}
$servers = [system.environment]::MachineName
foreach ($server in $servers){
get-mountpoints
}
$Flag = $global:volumes | Select $Check
If ($Flag -match "True") {
Write-EventLog -logname System -source OpsHealthScript -eventID 500 -Entrytype Error -message 'One or more Exchange mount points are below 10% free space.'
}
Else {
Write-EventLog -logname System -source OpsHealthScript -eventID 800 -Entrytype Information -message 'Exchange mount points are healthy.'
}
You can access the file here: mount-point-space.ps1
Once this is scheduled, you can setup alerting in a couple of ways, one is a simple alert detection within SCOM to detect Error 500 in the system event log, the other is a correlated alert detection so that each alert generated by the script does not create a new alert within SCOM. I'll go over that in additional detail.
Showing posts with label "Operations Manager". Show all posts
Showing posts with label "Operations Manager". Show all posts
Thursday, July 30, 2015

Thursday, January 8, 2015
Operations Manager Performance Trending with Excel - No SQL Required
A powerful tool for administrators is to trend data to troubleshoot performance problems and forecast future resource needs. In the past, I've run SQL queries but needed a way to instruct support staff on a basic means to accomplish the same tasks right from the console. Thankfully, Operations Manager and Excel allow just that.
Let's get started.
Fire up the Operations Manager Console to the Monitoring section, then open the Windows Computers view (or any section where you access the computer health view, such as SQL)

Find a server you're interested in or simply select one from the list.
 After selecting the system, select the Performance View under the Navigation pane of the task panel on the right side of the management console.
 Once the Performance View window comes up, in the Performance Actions pane on the right side of the console, change your time frame via Select Time Range, selecting a meaningful period, such as two weeks or longer.

 Now at the bottom of the performance monitor screen, select a counter you're interested. I'll use Percent Memory Used for this example.

When selected, a graph should display such as the following:
 Going back to the Performance Actions pane, select Copy Data to Clipboard
Open up notepad and past the contents, which should look similar to the following:

Save the file with an xml extension

 Now open Excel, select the Data tab and select From Other Sources -> From XML Data Import

Select the XML file created earlier; accept the import defaults when prompted

This should populate the Excel spreadsheet with an X and Y column. The first column is the date/time stamp and the Y column is the performance data.
 Select all of the Y data and with it highlighted, select the Insert tab -> Line -> 2-D Line to generate a graph.

This should yield a graph in Excel such as the following:

Right-click on the graph line and select Add Trendline

Generally, accepting the default will paint a trendline that is helpful for finding issues such as a memory leak or consistent data usage on a hard drive. However, you can play around with the trend to perform longer-term forecasts. I added 50 periods to the end of my trend line to see how memory might look in the future after my data set.
 Graph results with the trendline:
 The line extends a bit beyond the graph data and shows an overall flat trend on memory utilization. If the server had a memory leak, as an example, the graph might trend steadily upwards like this:
 There you have it, a simple but powerful tool for analyzing data recorded in SCOM without a lot of effort.
Let's get started.
Fire up the Operations Manager Console to the Monitoring section, then open the Windows Computers view (or any section where you access the computer health view, such as SQL)
Find a server you're interested in or simply select one from the list.
When selected, a graph should display such as the following:
Open up notepad and past the contents, which should look similar to the following:
Save the file with an xml extension
Select the XML file created earlier; accept the import defaults when prompted
This should populate the Excel spreadsheet with an X and Y column. The first column is the date/time stamp and the Y column is the performance data.
This should yield a graph in Excel such as the following:
Right-click on the graph line and select Add Trendline
Generally, accepting the default will paint a trendline that is helpful for finding issues such as a memory leak or consistent data usage on a hard drive. However, you can play around with the trend to perform longer-term forecasts. I added 50 periods to the end of my trend line to see how memory might look in the future after my data set.
Friday, November 15, 2013
SCOM 2012 Powershell - Retrieving a List of Computers in a Group
Had to search for a batch file that is on one of the many SQL servers we have in the environment. First inclination was, let me pull the systems from SCOM since it has all our SQL servers.
Poked around the interwebs a while and noticed a lot of scripts had references to 2007 commands that hadn't been updated to 2012. Here's the basic steps taken to get my group of SQL servers. You could perform the same task on pretty much any group in the same manner.


Poked around the interwebs a while and noticed a lot of scripts had references to 2007 commands that hadn't been updated to 2012. Here's the basic steps taken to get my group of SQL servers. You could perform the same task on pretty much any group in the same manner.
- Open the Operations Manager Shell powershell console
- Type in : Get-SCOMGroup
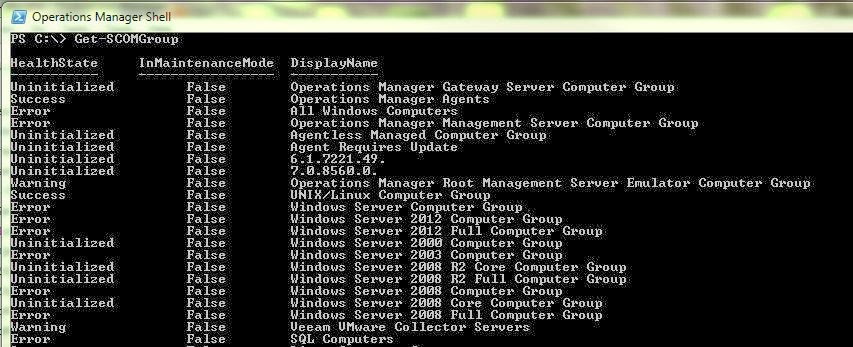
- Search for the group you want to retrieve members from
- Now type in: $Group = Get-SCOMGroup | where {$_.DisplayName -eq "SQL Computers"} (or insert the group your looking for instead of SQL Computers")

- Next, type in: $Members = $Group.GetRelatedMonitoringObjects()

- Now, you can simply type: $Members

- Or, pipe the command out to a file: $Members | Sort DisplayName | FT DisplayName | out-file C:\Scripts\Servers.txt

Monday, March 26, 2012
Powershell script to stop system maintenance mode
In the event you want to pull the computer out of maintenance mode for some reason, here is the script for ending the maintenance mode. The command line prompts could be hard coded as variables or you could add a $params statement to the front of the script to feed in a variable.
$RMSFQDN = Read-Host "Enter the FQDN of your management server"
$Name = "Microsoft.EnterpriseManagement.OperationsManager.Client"
$ModuleLoaded = Get-Pssnapin $Name -ErrorAction SilentlyContinue
If (-not $ModuleLoaded)
{
add-pssnapin "Microsoft.EnterpriseManagement.OperationsManager.Client";
}
New-ManagementGroupConnection -ConnectionString $RMSFQDN
Set-Location "OperationsManagerMonitoring::";
$computerClass = get-monitoringclass -name:Microsoft.SystemCenter.ManagedComputer
$computerPrincipalName = Read-Host "Enter the FQDN computer name for ending maintenance:"
$computerCriteria = "PrincipalName='" + $computerPrincipalName + "'"
$computer = get-monitoringobject -monitoringclass:$computerClass -criteria:$computerCriteria
if($computer -eq $null)
{
$unixClass = get-monitoringclass -name "Microsoft.Unix.Computer"
$monObject = Get-MonitoringObject -monitoringclass:$unixClass
$computer = $monObject | where {$_.displayname -eq $computerPrincipalName}
}
ELSE
{
$computerClass = get-monitoringclass -name:Microsoft.Windows.Computer
$computer = get-monitoringobject -monitoringclass:$computerClass -criteria:$computerCriteria
}
if($computer.InMaintenanceMode -eq $true)
{
"Stopping maintenance mode for: " + $computerPrincipalName
$computer.StopMaintenanceMode([DateTime]::Now.ToUniversalTime(),[Microsoft.EnterpriseManagement.Common.TraversalDepth]::Recursive);
}
ELSE
{
"The computer " + $computerPrincipalName + " is not in maintenance mode."
}
$RMSFQDN = Read-Host "Enter the FQDN of your management server"
$Name = "Microsoft.EnterpriseManagement.OperationsManager.Client"
$ModuleLoaded = Get-Pssnapin $Name -ErrorAction SilentlyContinue
If (-not $ModuleLoaded)
{
add-pssnapin "Microsoft.EnterpriseManagement.OperationsManager.Client";
}
New-ManagementGroupConnection -ConnectionString $RMSFQDN
Set-Location "OperationsManagerMonitoring::";
$computerClass = get-monitoringclass -name:Microsoft.SystemCenter.ManagedComputer
$computerPrincipalName = Read-Host "Enter the FQDN computer name for ending maintenance:"
$computerCriteria = "PrincipalName='" + $computerPrincipalName + "'"
$computer = get-monitoringobject -monitoringclass:$computerClass -criteria:$computerCriteria
if($computer -eq $null)
{
$unixClass = get-monitoringclass -name "Microsoft.Unix.Computer"
$monObject = Get-MonitoringObject -monitoringclass:$unixClass
$computer = $monObject | where {$_.displayname -eq $computerPrincipalName}
}
ELSE
{
$computerClass = get-monitoringclass -name:Microsoft.Windows.Computer
$computer = get-monitoringobject -monitoringclass:$computerClass -criteria:$computerCriteria
}
if($computer.InMaintenanceMode -eq $true)
{
"Stopping maintenance mode for: " + $computerPrincipalName
$computer.StopMaintenanceMode([DateTime]::Now.ToUniversalTime(),[Microsoft.EnterpriseManagement.Common.TraversalDepth]::Recursive);
}
ELSE
{
"The computer " + $computerPrincipalName + " is not in maintenance mode."
}
Thursday, January 26, 2012
Adding Red Hat Agents to SCOM 2007
Ok, ok... this is supposed to be all about SCOM 2012. Well, came across a situation with 2007 and there was enough complexity that I wanted to make sure I got it all in one place.
- Similar to the 2012 install, load the appropriate linux agent to the system and install the rpm package.
- Ensure you have the management packs installed in SCOM 2007, usually the Linux and Unix libraries along with the Linux flavors you wan to monitor.
- Now, attempt to discover the Linux computer, enable SSH discover and use the FQDN of the Linux system.
- You will likely receive a certificate signing error. If that is the case, check out the Microsoft Wiki entry on the issue:
- https://social.technet.microsoft.com/wiki/contents/articles/6203.aspx
- Run through the discovery and installation again.
- Things are likely to fail, again
- Now look at the article:
- http://operatingquadrant.com/2012/01/12/opsmgr-unixlinux-heartbeat-failures-after-applying-kb2585542/
- Alternatively, you can add the 32bit DWORD value:HKEY_LOCAL_MACHINE\SYSTEM\CurrentControlSet\Control\SecurityProviders\SCHANNEL\ SendExtraRecord = 2
- The agent should pop into monitoring console at this point. If not, run the discover for a third time.
- Finally, check your ops manager event logs. You may be getting errors about the health service or workflow on the Linux system. Check out the following article for configuring cross platform runas accounts:
- http://technet.microsoft.com/en-us/library/dd788981.aspx
Subscribe to:
Posts (Atom)