This will start a series of posts related to finally extracting that disk report you've always wanted from SCOM but just couldn't find anywhere, at least not for free. We're going to start with the basics of getting the logical disk size into the datawarehouse so that you can query it later for a SQL report view, or you can use it in the generic report library->performance report or even a workspace performance view. The cool thing with doing it this way is that you can then trend on disk size over time. In a virtual environment, where it is relatively easy to grow a disk, you will be able to go back in time and see when that growth occurred and by how much. That can be a handy report sometimes.
- Start by opening your Microsoft System Center Management Console and navigating to the "Authoring Screen"
- In the "Authoring Screen", right-click on "Rules" and select the "Create a new rule" option
- In the "Create Rule Wizard", expand the "Collection Rules" folder, then the "Performance Based" folder and select "WMI Performance"
- When the rule screen comes up, you'll need to provide a name for the rule and select the target for the rule. Leave the "Rule Category" alone.
- In the "Rule Target" selection screen, change the scope to "View all Targets" and look for "Logical Disk (Server)". Select that and hit "OK" to finish the selection.
- Before proceding, your screen should look something like this.
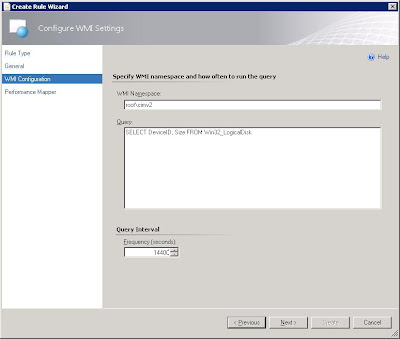
- In the next screen, you'll have to insert your WMI query. For the purposes of this monitor, we really only care about two values, the DeviceID (drive letter) and the Size. That keeps the data returned relatively small to have minimal impact on performance. If you left it as SELECT * and then run the rule, it will bog down SCOM significantly, trust me on that one. Enter how often you want to collect the information. Since total disk size does not change often, you can have a large value here, 14400 would be once every four hours if I have my math right.
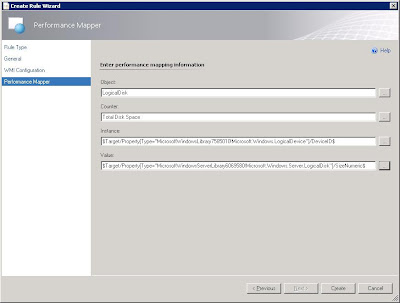
- On the following screen, you'll need to select the values to collect and how the labels should show up when looking for them in the performance monitors. You want the "Object" to be LogicalDisk, this way you can search the datawarehouse for logicaldisk counters and it will show up in the same grouping. This will also allow the value to show up in the same group as your other Logical Disk performance counters elsewhere in the system. You want to give the "Counter" value a name, such as "Total Disk Space" or "Total Disk Size" something to identify this counter as representing the size of the partition in question.
- For the "Instance" Value, let's use the picker, select the "..." on the side and then "Target"
- In the target picker screen, let's pick the "Device Identifier"
- Now let's repeat the process for the "Value" field
- Select the "..." on the side and then "Target"
- In the target picker screen, let's pick the "Size (MBytes) (Numeric)"
- Your Rule Wizard should now look something like this and you are ready to finish the rule. It will initially gather data pretty quickly so you shouldn't have to wait too long before you can go searching for it. This will pick up the space for all logical instances on the Windows servers in your environment.
For the WMI Namespace, enter: root\cimv2
For the Query, enter: SELECT DeviceID,Size FROM Win32_LogicalDisk
In Part 2 of this series, I will outline a SQL query to dump the information in a basic table and a tabular report format, along with other ways to access this information in SCOM. In Part-3, I hope to put together a fancy, graphical report of all the data (we'll see on that one).


This comment has been removed by the author.
ReplyDeleteExcellent Post Dave,
ReplyDeleteDo we have an alternative option to generate Notification For this rule apart from Part 2 SQL bit Please
Your disk space alerts in general would be done through standard mechanisms. This post really only helps if you want to deliver a report to your manager or customer. For example, I have my system setup to send out a disk space report to the server teams every Friday, so that we don't get into disk space issues over the weekend, which nobody likes. Here is a link to a great post on setting up the disk monitors: http://blogs.technet.com/b/jonathanalmquist/archive/2009/04/04/logical-disk-free-space-monitor.aspx
ReplyDeleteOnce you have your thresholds configured the way you want, there is a utility called Philip (http://www.softpedia.com/get/System/File-Management/Philip.shtml) which you can use to fill your drive up to generate an alert, from there, you would subscribe to the alert for email or IM.
Hi
ReplyDeleteAt step 3 you select a "Custom Performance Collection Rules" in the Management pack, how did you create that. And what did you create in it.
Without this information you article is unusable
Otherwise it looks to be a great article something Microsoft show do out of the pack
Jim Prendergast
Select "New" and give the new management pack the name that you like. I called mine "Customer Performance Collection Rules" but you could realistically give it any name you wanted to.
DeleteHello,
ReplyDeleteIs there a report for the disk size used and what is left?
Hi,
ReplyDeletecan we modify the query to include volume label as well
I modified the script
SELECT DeviceID,Size,VolumeName FROM Win32_LogicalDisk
now i want to include it in the performance mapper
Hi,
ReplyDeleteI changed the query so that it does not show empty ones (A:) and only Device Type 3 (ok, does not show A: as well; however):
SELECT DeviceID,Size FROM Win32_LogicalDisk WHERE Size > 0 AND DriveType = 3
Thanks for the posting.
OK, I thought drives with no value were the problem for convertion issues - they were not. Created an override to disable it for WS 2003 Logical Disk.
Delete