If you have a large server list and you quickly want to add rights for your action account, check out this helpful method. Just go to active directory and create a query for your servers, then remove the columns (outside of the server names). I've enclosed the query definition. Drop this into an xml file and import into Active Directory, under "Saved Queries".
<QUERY><NAME>Servers</NAME><DESCRIPTION></DESCRIPTION><DN></DN><FILTERLASTLOGON>-1</FILTERLASTLOGON><LDAPQUERY>(&(&(sAMAccountType=805306369)(objectCategory=computer)(objectClass=computer)(operatingSystem=Windows\20Server*)))</LDAPQUERY><ONELEVEL>FALSE</ONELEVEL><COLUMNID>{5AAC0BFD-BFA4-44BB-95A9-EF6CCC1F64EF}</COLUMNID></QUERY>
Here is the link to the site:
http://www.bluemoonpcrepair.com/wp/?p=145
Friday, June 14, 2013

Thursday, May 2, 2013
Where Did My LINUX RPMs Go?! @##%&&%
Some time ago, I created a video and wrote a blog on a quick and painless way to install the LINUX agents for SCOM. Well, came time to do that again and I noticed, even after downloading the management packs from the catalog, I could not find the rpm files!
After some exasperating searching and much gnashing of the teeth, I finally found the download for the updated management packs. Installing the ones from this pack will give you the rpms. In the past, the rpms could be found on the CD/DVD.
System Center 2012 Monitoring Pack for UNIX and Linux Operating Systems :
http://www.microsoft.com/en-us/download/details.aspx?id=29696
After some exasperating searching and much gnashing of the teeth, I finally found the download for the updated management packs. Installing the ones from this pack will give you the rpms. In the past, the rpms could be found on the CD/DVD.
System Center 2012 Monitoring Pack for UNIX and Linux Operating Systems :
http://www.microsoft.com/en-us/download/details.aspx?id=29696
Monday, March 11, 2013
Upcoming topics on SCOM
Haven't had a chance to post anything recently, but it's not for a lack of trying. I have 41 pages of screen shots and instructions that walk folks through the SNMP troubleshooting, from creating the LINUX test system through to getting the alerts in SCOM, trying to walk through where your SNMP setup could be failing. Also going to post pulling raw metrics for analysis in Excel. SQL Reporting is nice, but it can be overly complicated when sometimes, you just want some quick data and some graphs. Finally, will be posting another method for organizing data outside of the datawarehouse. This will provide a safer method of writing your own reports and views without disturbing the installation.
Friday, February 15, 2013
System Center Installer - OMServer.msi returned error 1603
Having problems installing your secondary management server, maybe even your primary? Great post about pre-requisites. Setting up our secondary server, the management server installer was failing. I had made sure to install the report viewer modules, .NET 4.0 but forgot .NET 3.51. The installer won't tell you directly that the prerequisite was missing and will simply fail, leaving you to pour through a large install log to find the problem.
If you're seeing this in your install log, it may be the same case:
Always: :LaunchMSI: Setting rollback to true
[16:58:55]: Error: :LaunchMSI: MSI C:\SCOMSP1\Setup\AMD64\Server\OMServer.msi returned error 1603
Check Christopher Keyaert's article for additional information and other troubleshooting steps.
http://www.vnext.be/2013/01/24/scom-2012-sp1-omserver-msi-returned-error-1603/
If you're seeing this in your install log, it may be the same case:
Always: :LaunchMSI: Setting rollback to true
[16:58:55]: Error: :LaunchMSI: MSI C:\SCOMSP1\Setup\AMD64\Server\OMServer.msi returned error 1603
Check Christopher Keyaert's article for additional information and other troubleshooting steps.
http://www.vnext.be/2013/01/24/scom-2012-sp1-omserver-msi-returned-error-1603/
Monday, February 11, 2013
Way to Mass Uninstall System Center Agents on Remote Computers
I needed to remove the agents on a number of computers and naturally, I wanted a quick way of doing so. I had a csv output from an active directory query but needed a way to use that to uninstall the agent. The following powershell script will allow you to do just so. It may or may not work on certain 2000 and 2003 installations. I am working on a script that works on all systems. In the mean time, here you go.
$Servers="computer1","computer2", "computer3"
FOREACH ($TargetServer in $servers){(Get-WmiObject -Class Win32_Product -Filter "Name='System Center Operations Manager 2012 Agent'" -ComputerName $TargetServer ).Uninstall()}
$Servers="computer1","computer2", "computer3"
FOREACH ($TargetServer in $servers){(Get-WmiObject -Class Win32_Product -Filter "Name='System Center Operations Manager 2012 Agent'" -ComputerName $TargetServer ).Uninstall()}
Errors with SCOM 2012 SP1 Upgrade or Installation
Upgraded to SCOM 2012 SP1 last week and exposed an few errors for those who may have gone a little to fast in the installation. Chances are, if you are seeing the following errors, you may have forgotten to change the "Data Access Service" option during the upgrade to a domain account. If you leave it a service account, you will get the following errors post upgrade. Now, the good thing is, if you've done this and can no longer log into the management console, go back to your server, hunt down the System Center Data Access Service and change the login from "Local Service" to your data access account that was created during the original installation of System Center.
Also, if you are starting from scratch with an SP1 installation, you will need to add trailing "\" back slashes on the SQL directories. If you do not, the Datawarehouse installation will likely fail and roll the entire installation back. So, when you perform the SQL server discovery during installation, the installer will find your data and log directories and populate them automatically as such:
"D:\SQL Data"
"L:\SQL Logs"
You need to change these to the following format (obviously your drives and directories may differ)
"D:\SQL Data\"
"L:\SQL Logs\"
And then your System Center Operations Manager 2012 SP1 installation should proceed.
Errors you may encounter if you do not have a domain login for the Data Access account:
Inner Exception.Type: Microsoft.EnterpriseManagement.Common.ServiceNotRunningException, Exception Error Code: 0x80131604, Exception.Message: The Data Access service is either not running or not yet initialized. Check the event log for more information.
Event 29120
OpsMgr Management Configuration Service failed to process configuration request (Xml configuration file or management pack request) due to the following exception
System.Runtime.Remoting.RemotingException: Unable to get ISdkService interface. Please make sure local Sdk Service is running.
at Microsoft.EnterpriseManagement.ManagementConfiguration.Communication.CredentialDataProvider.CreateSdkConnector()
Event 29195
OpsMgr Management Configuration Service failed to communicate with System Center Data Access Service due to the following exception
System.Runtime.Remoting.RemotingException: Unable to get ISdkService interface. Please make sure local Sdk Service is running.
Event 26380
The System Center Data Access service failed due to an unhandled exception.
The service will attempt to restart.
Exception:
Microsoft.EnterpriseManagement.Common.SdkServiceNotInitializedException: The Data Access service has not yet initialized. Please try again.
Event 26340
System Center Data Access Service and/or System Center Management is unresponsive because Authorization Manager is unable to recover from database errors. Please restart services System Center Data Access Service and System Center Management.
Also, if you are starting from scratch with an SP1 installation, you will need to add trailing "\" back slashes on the SQL directories. If you do not, the Datawarehouse installation will likely fail and roll the entire installation back. So, when you perform the SQL server discovery during installation, the installer will find your data and log directories and populate them automatically as such:
"D:\SQL Data"
"L:\SQL Logs"
You need to change these to the following format (obviously your drives and directories may differ)
"D:\SQL Data\"
"L:\SQL Logs\"
And then your System Center Operations Manager 2012 SP1 installation should proceed.
Errors you may encounter if you do not have a domain login for the Data Access account:
Inner Exception.Type: Microsoft.EnterpriseManagement.Common.ServiceNotRunningException, Exception Error Code: 0x80131604, Exception.Message: The Data Access service is either not running or not yet initialized. Check the event log for more information.
Event 29120
OpsMgr Management Configuration Service failed to process configuration request (Xml configuration file or management pack request) due to the following exception
System.Runtime.Remoting.RemotingException: Unable to get ISdkService interface. Please make sure local Sdk Service is running.
at Microsoft.EnterpriseManagement.ManagementConfiguration.Communication.CredentialDataProvider.CreateSdkConnector()
Event 29195
OpsMgr Management Configuration Service failed to communicate with System Center Data Access Service due to the following exception
System.Runtime.Remoting.RemotingException: Unable to get ISdkService interface. Please make sure local Sdk Service is running.
Event 26380
The System Center Data Access service failed due to an unhandled exception.
The service will attempt to restart.
Exception:
Microsoft.EnterpriseManagement.Common.SdkServiceNotInitializedException: The Data Access service has not yet initialized. Please try again.
Event 26340
System Center Data Access Service and/or System Center Management is unresponsive because Authorization Manager is unable to recover from database errors. Please restart services System Center Data Access Service and System Center Management.
Thursday, December 27, 2012
Setup a Disk Report in SCOM 2012 (Part-3)
Finally got around to getting all the screen shots for the updated post for creating a more visually useful report. Now I don't have to make a new years resolution to get it done.
Recall in Part-2 of Setting up a Logical Disk Report for SCOM 2012 that a new view was created to make life a little easier. It was named “vCustomHourlyLogicalDiskPerf”. We will continue to use this view in the design of our updated, color-coded report. I was going to switch over to Visual Studio for this update, but decided to stick with Report Builder 3.0, which is a tool that comes with SQL or can be downloaded for free.
I will be more to the point with this post since I have covered other topics in parts one and two. Please refer back to those if you get stuck here. I presume you have already created the SQL view, which this post will utilize and was created earlier in Part-2.
Open Microsoft Report Builder 3.0 and connect to your SQL server housing the Operations Manager data warehouse. Start with a blank report project.

In the blank report, go ahead and resize out to about 8 inches for width.

Let’s add a quick title. For this, we’ll call it “Less than 10% Free Logical Disk Report”

Now let’s add the datasource:

Select the “Use a connection embedded in my report” and enter the connection string to DataWarehouseMain

data source=<SQL DW Server>;initial catalog=OperationsManagerDW;Integrated Security=SSPI

For the time being, change the credentials to “Use Current Windows User”. This will be changed after the report is complete, but use this for now in order to connect to the database and finish the report.
Now let us add a dataset:

We are going to do a slightly different dataset here than the one used in Part-2 of the series. For the purposes of this report, I want it to give me the status of disk space as of the last day. Since we’re trying to keep this simple and hack the code, we can run into accuracy issues with the construction of this report if more than one day of data is used. Additionally, I use this report each Friday so I know the disks that are currently having space issues so I can remediate the problems prior to the weekend and hopefully, avoid an outtage or after-hours call.
Here is the select statement for this dataset. Notice, I am hard coding the dates here. No variables will have to be used when this report runs. This makes it fast to use and easy to schedule. Notice some of the exclusions in the last section of the query. I am specifically removing the “total” metric, which can add redundant data. I also remove volume links that may be reported by services such as clustering or exchange, but effectively have the same data as the logical disk link. I could also exclude servers here that I know I don’t care about but that might have monitoring data, such as a backup server, video server, etc.
DECLARE @Start_Date DATETIME
DECLARE @End_Date DATETIME
SET @Start_Date = DateAdd(d,-1,GETDATE())
SET @End_Date = GETDATE()
select
[Total Disk Space],
[Free Megabytes],
[% Free Space],
InstanceName,
Path,
DateTime
from
(select CounterName, AverageValue,InstanceName, Path,DateTime
FROM vCustomHourlyLogicalDiskPerf) AS SourceTable
PIVOT
(
AVG (AverageValue) FOR CounterName IN ([Total Disk Space],[Free Megabytes],[% Free Space])
) AS PivotTable
WHERE
DateTime >= @Start_Date AND
DateTime <= @End_Date AND
NOT InstanceName = '_Total' AND
NOT InstanceName Like '\\?\Volume%%' AND
[% Free Space] <= 10.00

With the query complete, let’s get the report up and running. This report will include a status bar to visually show the disk space left as well as color coding to show really critical space issues in red and warnings in orange.
Start by inserting a matrix into the report fields. Just drag and drop the matrix onto the report itself and then reposition to the upper-left, just under the title


Grab the “Path” variable from the dataset and drag to the lower left corner of the matrix:

Next, add a child group to the “Row Groups”:

Add the “Instance Name to the row child group”

On the third, remaining column, select the top of the column and right-click to add another column within the group. This needs to be repeated four times.
 Should now have something that looks like this:

We’ll need to split the top header. Right click on the top header to bring up the context menu and select “Split Cells”

Now, in this order, drag and drop the total disk space, free disk space and % free metrics into the bottom of each column. Leave a space between “free disk space” Should look something like the following:

This isn’t very handy, since we don’t want the sum of these metrics. So we’ll want to adjust each field, starting with “Total Disk”, right click on the field and select the “expression” option.

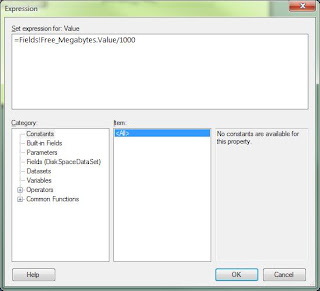
Let’s change this to the actual value along with converting it into Gigabytes, from the default Megabytes.

Now do the same with free space.
For the next field, which is blank, we’ll call it used disk space Used (GB). Here, we’ll use a calculated field. We could have done this in the SQL query itself, but I chose to do this differently. The expression here should include the total disk space minus the free disk space.
=(Fields!Total_Disk_Space.Value-Fields!ID__Free_Space.Value)/1000

Then finally on to percent free space.

For this field, we are going to add a color coding mechanism. Right click on the ID_Free_space and select the “Text Box Properties”

Navigate to Font, and select the expression applet next to color.

Add the following expression in the "Color" field
=IIF(Fields!ID__Free_Space.Value >= 10, "Green", IIF(Fields!ID__Free_Space.Value >= 5, "Orange", "Red"))
What this is saying is, any field greater than 10% free space will show up as green, otherwise, anything between 10 and 5 will turn orange and anything under 5 will turn red. If this report had not been limited already to items under 10%, it would have made the corresponding report much easier to figure out which items were critical.
Under the “Insert” menu item in the report builder, select “Gauge” and then select the lower-right, empty column, to insert the visual gauge for free space.

We’ll choose the “Bullet Graph” under linear gauges.

Double-click on the gauge and for the “LinearPointer1” values, select the “ID_Free_Space” field and then delete “LinearPointer2”. The gauge will also want to sum up the values. Go back to the expression and remove the SUM option.

For the gauge, we’ll want similar fill options to our numerical values. Select the small line in the gauge, then right-click and select the “Pointer Properties”.

Select the “Pointer Fill” option and adjust the expression for the “Color” and “Secondary Color” with the following expression.
=IIF(Fields!ID__Free_Space.Value >= 10, "Green", IIF(Fields!ID__Free_Space.Value >= 5, "Orange", "Red"))

Adjust the column widths and get things all squared up. Now your report should look something like this:

Now go back to the properties of DataWarehouseMain and change the credentials back to “Do not use Credentials”

Now save the report to the SCOM reporting server.
The report is almost ready to be completed and viewed. Login to the web interface of the report server.
Usually with the syntax ofhttp://<report server>/Reports.
Select the "Details View" and look for the DataWarehouseMain object and select it. Go into the object properties and copy the selection string. Now find the report you just created, and select the manage option in the drop down menu.

Go to the “Data Sources” tab for the report and delete the existing connection string and replace with the one copied from DataWarehouseMain. Also ensure that “Credentials are not required” is selected. Apply the changes.
You should now be able to run the report. Depending on the cleanup you did in the report format, you may need to go back and make some changes. In my example, I did not adjust the numerical formatting for each text field and ended up with too many decimals in the fields. So long as you are only changing text field properties, you should be able to save the report without altering any connection string settings.

To correct this, open a text box property, select the “Number” tab and change the format to “Number” with 2 decimal places.


Now the output looks like this, which is much better:


Good luck and happy report writing. There is a little bit of everything in this post and hopefully this helps get you started with additional techniques.
Recall in Part-2 of Setting up a Logical Disk Report for SCOM 2012 that a new view was created to make life a little easier. It was named “vCustomHourlyLogicalDiskPerf”. We will continue to use this view in the design of our updated, color-coded report. I was going to switch over to Visual Studio for this update, but decided to stick with Report Builder 3.0, which is a tool that comes with SQL or can be downloaded for free.
I will be more to the point with this post since I have covered other topics in parts one and two. Please refer back to those if you get stuck here. I presume you have already created the SQL view, which this post will utilize and was created earlier in Part-2.
Open Microsoft Report Builder 3.0 and connect to your SQL server housing the Operations Manager data warehouse. Start with a blank report project.

In the blank report, go ahead and resize out to about 8 inches for width.

Let’s add a quick title. For this, we’ll call it “Less than 10% Free Logical Disk Report”

Now let’s add the datasource:
Select the “Use a connection embedded in my report” and enter the connection string to DataWarehouseMain

data source=<SQL DW Server>;initial catalog=OperationsManagerDW;Integrated Security=SSPI

For the time being, change the credentials to “Use Current Windows User”. This will be changed after the report is complete, but use this for now in order to connect to the database and finish the report.
Now let us add a dataset:
We are going to do a slightly different dataset here than the one used in Part-2 of the series. For the purposes of this report, I want it to give me the status of disk space as of the last day. Since we’re trying to keep this simple and hack the code, we can run into accuracy issues with the construction of this report if more than one day of data is used. Additionally, I use this report each Friday so I know the disks that are currently having space issues so I can remediate the problems prior to the weekend and hopefully, avoid an outtage or after-hours call.
Here is the select statement for this dataset. Notice, I am hard coding the dates here. No variables will have to be used when this report runs. This makes it fast to use and easy to schedule. Notice some of the exclusions in the last section of the query. I am specifically removing the “total” metric, which can add redundant data. I also remove volume links that may be reported by services such as clustering or exchange, but effectively have the same data as the logical disk link. I could also exclude servers here that I know I don’t care about but that might have monitoring data, such as a backup server, video server, etc.
DECLARE @Start_Date DATETIME
DECLARE @End_Date DATETIME
SET @Start_Date = DateAdd(d,-1,GETDATE())
SET @End_Date = GETDATE()
select
[Total Disk Space],
[Free Megabytes],
[% Free Space],
InstanceName,
Path,
DateTime
from
(select CounterName, AverageValue,InstanceName, Path,DateTime
FROM vCustomHourlyLogicalDiskPerf) AS SourceTable
PIVOT
(
AVG (AverageValue) FOR CounterName IN ([Total Disk Space],[Free Megabytes],[% Free Space])
) AS PivotTable
WHERE
DateTime >= @Start_Date AND
DateTime <= @End_Date AND
NOT InstanceName = '_Total' AND
NOT InstanceName Like '\\?\Volume%%' AND
[% Free Space] <= 10.00

With the query complete, let’s get the report up and running. This report will include a status bar to visually show the disk space left as well as color coding to show really critical space issues in red and warnings in orange.
Start by inserting a matrix into the report fields. Just drag and drop the matrix onto the report itself and then reposition to the upper-left, just under the title

Grab the “Path” variable from the dataset and drag to the lower left corner of the matrix:

Next, add a child group to the “Row Groups”:

Add the “Instance Name to the row child group”

On the third, remaining column, select the top of the column and right-click to add another column within the group. This needs to be repeated four times.


We’ll need to split the top header. Right click on the top header to bring up the context menu and select “Split Cells”

Now, in this order, drag and drop the total disk space, free disk space and % free metrics into the bottom of each column. Leave a space between “free disk space” Should look something like the following:

This isn’t very handy, since we don’t want the sum of these metrics. So we’ll want to adjust each field, starting with “Total Disk”, right click on the field and select the “expression” option.
Let’s change this to the actual value along with converting it into Gigabytes, from the default Megabytes.

Now do the same with free space.

For the next field, which is blank, we’ll call it used disk space Used (GB). Here, we’ll use a calculated field. We could have done this in the SQL query itself, but I chose to do this differently. The expression here should include the total disk space minus the free disk space.
=(Fields!Total_Disk_Space.Value-Fields!ID__Free_Space.Value)/1000

Then finally on to percent free space.

For this field, we are going to add a color coding mechanism. Right click on the ID_Free_space and select the “Text Box Properties”
Navigate to Font, and select the expression applet next to color.

Add the following expression in the "Color" field
=IIF(Fields!ID__Free_Space.Value >= 10, "Green", IIF(Fields!ID__Free_Space.Value >= 5, "Orange", "Red"))
What this is saying is, any field greater than 10% free space will show up as green, otherwise, anything between 10 and 5 will turn orange and anything under 5 will turn red. If this report had not been limited already to items under 10%, it would have made the corresponding report much easier to figure out which items were critical.
Under the “Insert” menu item in the report builder, select “Gauge” and then select the lower-right, empty column, to insert the visual gauge for free space.

We’ll choose the “Bullet Graph” under linear gauges.

Double-click on the gauge and for the “LinearPointer1” values, select the “ID_Free_Space” field and then delete “LinearPointer2”. The gauge will also want to sum up the values. Go back to the expression and remove the SUM option.

For the gauge, we’ll want similar fill options to our numerical values. Select the small line in the gauge, then right-click and select the “Pointer Properties”.

Select the “Pointer Fill” option and adjust the expression for the “Color” and “Secondary Color” with the following expression.
=IIF(Fields!ID__Free_Space.Value >= 10, "Green", IIF(Fields!ID__Free_Space.Value >= 5, "Orange", "Red"))

Adjust the column widths and get things all squared up. Now your report should look something like this:

Now go back to the properties of DataWarehouseMain and change the credentials back to “Do not use Credentials”

Now save the report to the SCOM reporting server.
The report is almost ready to be completed and viewed. Login to the web interface of the report server.
Usually with the syntax ofhttp://<report server>/Reports.
Select the "Details View" and look for the DataWarehouseMain object and select it. Go into the object properties and copy the selection string. Now find the report you just created, and select the manage option in the drop down menu.

Go to the “Data Sources” tab for the report and delete the existing connection string and replace with the one copied from DataWarehouseMain. Also ensure that “Credentials are not required” is selected. Apply the changes.
You should now be able to run the report. Depending on the cleanup you did in the report format, you may need to go back and make some changes. In my example, I did not adjust the numerical formatting for each text field and ended up with too many decimals in the fields. So long as you are only changing text field properties, you should be able to save the report without altering any connection string settings.

To correct this, open a text box property, select the “Number” tab and change the format to “Number” with 2 decimal places.

Now the output looks like this, which is much better:


Good luck and happy report writing. There is a little bit of everything in this post and hopefully this helps get you started with additional techniques.
Subscribe to:
Posts (Atom)