I am going to start by saying some of the tactics in here are likely not Microsoft supported, but they work. Before you make changes, ensure you have the previous settings written down somewhere and your data backed up. While I have not encountered any issues with this procedure, I suppose something could happen that I have not seen in the environments I manage.
There are also a few other ways of accomplishing the report writing, such as using Visual Studio. I wanted to use only free tools that are readily available for this exercise. The driving piece of this is getting access to the performance data. That has been a challenge for myself and many others out there. After this, you will be better prepared to pull a variety of performance metrics from your system in the way you want.
Saban's blog was able to point me to the location of the tables used for the performance data and he uses the Visual Studio method for creating the report. Lot of good information in his blog. Ultimately, I chose a different SQL query method to make it easier (in my opinion) working with the data.
http://skaraaslan.blogspot.com/2011/02/creating-custom-report-for-scom-2007-r2.html
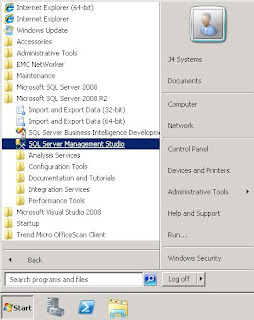
- Go ahead and connect to the SQL server running the OperationsManagerDW database using the SQL Management Studio. If you don't have the SQL management studio on your desktop then you may want to terminal into your database server and connect from there.
- When connecting, enter the SQL server name housing your OperationsManagerDW database.
- Once in the SQL Management Studio, browse through the tree to the OperationsManagerDW view tab, where you will right-click on "Views" and select "New View".
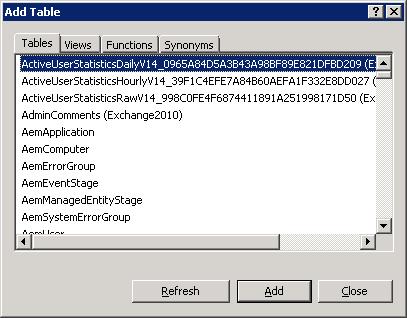
- A box will appear that allows you to grab specific tables or views to add for the query designer. Go ahead and just close this window.
- You will then be presented with a three pane window, the fields should be blank. Post the following SQL statements into the bottom pane (replacing any existing information), after which the view should look like the image following the SQL statements. This view will filter the results to only show the logical disk counters. You could leave the filter out so that you can use this view to poll any performance data. For now, use these statements to only look for LogicalDisk metrics.
- Run the query just to make sure data is getting polled correctly. If not, check to ensure everything has copied and pasted correctly and that the OperationsManagerDW database is selected to run the query against. After the query runs successfully, save the view.
- When the save dialog appears, use the name as shown, as the remainder of this tutorial will be based on this view. Otherwise, remember to change the references to this name with the one you input. The query could also be changed to reflect daily information. Simply go back to the select statement above and change the joins to include Perf.vPerfDaily instead of Perf.vPerfHourly
- At this point, we need to make an adjustment to the reporting service. Open the "Reporting Services Configuration Manager" and select the "Execution Account". Take note of the account used here.
- Now open the web management console for the SQL Reporting Server that runs your SCOM reports and select the detailed view in the report manager screen. Look for the Data Warehouse Main data source. Hovering over the entry should bring up a drop down menu, select that and click manage to open the properties of the Data Warehouse Main data connection.
- Go to the "Connect String" properties of the data connector and input the execution account credentials in this spot and save the changes.
- Now you will want to download the Microsoft SQL Server 2008 R2 Report Builder 3.0 software, http://www.microsoft.com/en-us/download/details.aspx?id=6116 (If you do not have SQL 2008 R2 installed, then download Microsoft SQL Server Report Builder 2.0. Report Builder 3.0 only works with SQL 2008 R2)
- Once downloaded and installed, open the report builder and select the "Blank Report" option. You may be promopted for a login to the report server. You should be able to use your local credentials. If those do not work, you may need additional rights to login to the SQL server with your account.
- Once in the "Blank Report", you will need to add a data source. Browse through the tree view on the left and right-click ont he "Data Source" folder to add a Data Source.
- From here you should be able to browse the datasources installed on the report server. The Data Warehouse Main connection should be found by browsing.
- With a datasource setup, you need to now add a dataset to pull the data. Browse the tree 5o "Datasets" and right-click to add a new dataset.
- In the "Dataset Properties", under the "Query" section, input the following code:
- After saving the dataset, you should see the variables for the dataset apear in the left-hand pane.
- In the Report Builder menu at the top, select "Insert" and select the down arrow under "Matrix" to manually insert a matrix table.
- You should be presented with a two row, two column matrix table. Start by dragging the "Path" variable to the lower-left box.
- Now click on the box with the [path] variable, right-click to bring up the context menu and browse down to "Add Group" and select a "Child Group" for the row.
- This will bring up a "Tablix group" dialog box. Select the [InstanceName] variable for this group.
- In the lower-right column, drag the [Total_Disk_Space] Variable to the box. This will want to change the value to the sum of all values. Right-click the field to bring up the expression option.
- Take out the SUM() calculation to leave just the "Total Disk Space" option.
- In the same column, right-click for the context menu and now lets select "Insert Column - Inside Group - > Right". Do this again to add another column.
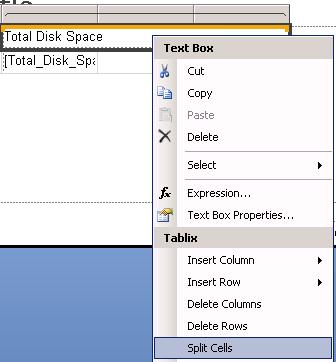
- Select the top header, right-click for the context menu and select the option to "Split cells". Now you can drag the [Free_Megabytes] variable to the next to last column and the [Used_Space] to the last column.
- Your report should now look something close to this, two rows and five columns, each with unique variables and headers.
- Once you run the report and can see the data, go ahead and save the report directly to the SCOM Report Server. If you select the "My Reports" folder, your report will show in the reports page under "Authored Reports"


SELECT
Perf.vPerfHourly.AverageValue,
dbo.vPerformanceRuleInstance.InstanceName, dbo.vPerformanceRule.ObjectName,
dbo.vPerformanceRule.CounterName, dbo.vPerformanceRuleInstance.LastReceivedDateTime,
Perf.vPerfHourly.DateTime,
dbo.vManagedEntity.DWCreatedDateTime,
dbo.vManagedEntity.ManagedEntityGuid,
dbo.vManagedEntity.ManagedEntityDefaultName,
dbo.vManagedEntity.DisplayName,
dbo.vManagedEntity.Name,
dbo.vManagedEntity.Path,
dbo.vManagedEntity.FullName
FROM
Perf.vPerfHourly INNER JOIN dbo.vPerformanceRuleInstance ON Perf.vPerfHourly.PerformanceRuleInstanceRowId = dbo.vPerformanceRuleInstance.PerformanceRuleInstanceRowId INNER JOIN dbo.vManagedEntity ON Perf.vPerfHourly.ManagedEntityRowId = dbo.vManagedEntity.ManagedEntityRowId INNER JOIN dbo.vPerformanceRule ON dbo.vPerformanceRuleInstance.RuleRowId = dbo.vPerformanceRule.RuleRowId
WHERE (dbo.vPerformanceRule.ObjectName = 'Logicaldisk')


select
[Total Disk Space],
[Free Megabytes],
[Total Disk Space]-[Free Megabytes] AS "Used Space",
InstanceName,
Path,
DateTime from
(
select
CounterName,
AverageValue,
InstanceName,
Path,
DateTime
FROM vCustomHourlyLogicalDiskPerf) AS SourceTable PIVOT ( AVG (AverageValue) FOR CounterName IN ([Total Disk Space],[Free Megabytes])
) AS PivotTable
WHERE
DateTime >= @Start_Date AND
DateTime <= @End_Date AND
NOT InstanceName = '_Total' AND
NOT InstanceName Like '\\?\Volume%%'
Alternatively, if you didn't setup or want to setup the WMI counters for logical disk size, you can extrapolate the information with the following query:
select
[Free Megabytes],[% Free Space],
[Free Megabytes]/([% Free Space]/100) AS "Total Disk Space",
([Free Megabytes]/([% Free Space]/100) - [Free Megabytes]) AS "Used Disk Space",
InstanceName,
Path,
DateTime
from
(select CounterName, AverageValue,InstanceName, Path,DateTime
FROM vCustomHourlyLogicalDiskPerf) AS SourceTable
PIVOT
(
AVG (AverageValue) FOR CounterName IN ([Free Megabytes],[% Free Space])
) AS PivotTable
WHERE
DateTime >= '7/17/2012' AND
DateTime <= '7/18/2012' AND
NOT InstanceName = '_Total' AND
NOT InstanceName Like '\\?\Volume%%' AND
[% Free Space] > 0.000001


This is a super basic, excel like report. In Part-3, we'll take a stab at adding some graphics and formatting the output for Gigabytes, instead of Megabytes, use commas and only two decimal places for the output of the data. By using custom views, you can aggregate a lot of information to query more easily later and with much simpler SQL statements. Those views may get delted during an update, so that is something to keep in mind, since it is a bit of a hack. If you find that you're missing data, you may want to up your collection interval for the devices or check for WMI connection errors on the servers you are collecting WMI performance data agains from Part-1.
Hi,
ReplyDeleteDo we have Part 3 of the series?
I do not seem to find it.
Regards,
Sri
No part-3 just yet. I do have most of the screen captures completed though and am working to finalize the procedure. Will be coming in the future.
ReplyDeleteHi Dave,
ReplyDeleteThanks for this excellent blog post. Really looking forward to part-3!
For now I ran into a problem: I only see data in the column 'Free Megabytes'. The columns 'Total Space' and 'Used Space' stays empty.
Any idea how I can fix this?
Best regards, Peter
Peter, did you setup the wmi total disk space rule I outlined in Part 1? If you did, but values are still not showing up, then you may need to check wmi queries against your servers using scriptomatic. If you cannot query values with scriptomatic, then you may have security problems with the mof files not allows wmi queries for those values on your servers. It also takes a few days to collect that wmi query information for the disk space.
ReplyDeleteHello Dave,
ReplyDeleteThanks for your answer. I've created the wmi total disk space rule as you described in Part 1. I saw a small typo "SELECT:" instead of "SELECT" in the wmi query. Maybe that's the problem. Otherwise I will try Scriptomatic to figure out if there is a permission problem.
Peter - did you ever solve this? I also am only getting data in the the free megabytes column
ReplyDeleteThis comment has been removed by the author.
ReplyDeleteI ran into a problem in the Dataset Properties...
ReplyDeleteInvalid object Name: vCustomHourlyLogicalDiskPerf
and yes, i created the View in SQL Management Studio (OperationsManagerDW) and there is exactly the same name with prefix dbo (dbo.vCustomHourlyLogicalDiskPerf)
Any idea how I can fix this?
Best regards, Mike
Hello Dave, This was a great help. I am also only getting the free megabytes. I verified that i followed all your steps. Is there anything else i can look at to find out why this is happening?
ReplyDeleteI would suggest downloading the Scriptomatic tool and ensuring when you query the value, it returns a number and doesn't error out. It's possible the WMI class is protected for some reason and not allowing the system to pull data. You can download the tool here - http://www.microsoft.com/en-us/download/details.aspx?id=12028
ReplyDeleteI would start with that, and then possibly increase the polling interval to try to capture more datapoints. I found on some systems, I had to set the capture to once every 30-60 minutes to have enough data points to make the queries work properly.
Dave, Thanks for the quick response. I will try that now and let you know what i find. Again thakn you for everything.
ReplyDeleteI ran Scriptomatic and i was trying to make sense of the data. This is why it took so long. When i run the query Win32_LogicalDisk i and getting information back. I can see See all the information there with no errors. I see Size & FreeSpace values. Does this mean that my wmi security is working correctly?
ReplyDeleteDave, Thanks it was the interval. I had to set it to 30 mins and not 60 and everything populated.
ReplyDeleteHI how do you increase the polling interval - marcus
ReplyDeleteHi,
ReplyDeleteHow can I include CPU and RAM in the SQL query .... How it would be ?
Any help will be highly appreciated.
Thanks in advance,
Basem
Hi,
ReplyDeleteSome Servers show all Values (Free Space, Used,..) and some only the value of the column 'Free Megabytes'.
Any idea?
Best regards
Manuela