After my niece used my computer this week, I came home to discover my system infected with a nasty virus that deleted the windows update service along with the Background Intelligent Transfer Service along with all sorts of other nasty things. This has nothing to do with System Center, but thought I would log it anyway since I had to create the service manually after an automated fix from Microsoft failed to restore the service to a functional state and I found no love in other forums.
First, check this link, it may help:
http://support.microsoft.com/kb/971058/en-us
From an Administrative command prompt, type the following to restore BITS (Background Intelligent Transfer Service)
sc create BITS type= share start= delayed-auto binPath= "C:\Windows\System32\svchost.exe -k netsvcs" tag= no DisplayName= "Background Intelligent Transfer Service"
There should be trailing spaces right after the equal signs. The service registered successfully and picked up the dependencies as well without having to add those manually. The service is dependent on RPCSs and EventSystem in the event you do have to add those.
Search This Blog
Friday, July 20, 2012
Wednesday, July 18, 2012
Setup a Disk Report in SCOM 2012 - (Part 2)
Now that we've started collecting disk space counters for logical drives in Part 1 of this series, let's whip together a quick report that shows the logical disk size, the logical disk space free and logical disk space used.
I am going to start by saying some of the tactics in here are likely not Microsoft supported, but they work. Before you make changes, ensure you have the previous settings written down somewhere and your data backed up. While I have not encountered any issues with this procedure, I suppose something could happen that I have not seen in the environments I manage.
There are also a few other ways of accomplishing the report writing, such as using Visual Studio. I wanted to use only free tools that are readily available for this exercise. The driving piece of this is getting access to the performance data. That has been a challenge for myself and many others out there. After this, you will be better prepared to pull a variety of performance metrics from your system in the way you want.
Saban's blog was able to point me to the location of the tables used for the performance data and he uses the Visual Studio method for creating the report. Lot of good information in his blog. Ultimately, I chose a different SQL query method to make it easier (in my opinion) working with the data.
http://skaraaslan.blogspot.com/2011/02/creating-custom-report-for-scom-2007-r2.html
This is a super basic, excel like report. In Part-3, we'll take a stab at adding some graphics and formatting the output for Gigabytes, instead of Megabytes, use commas and only two decimal places for the output of the data. By using custom views, you can aggregate a lot of information to query more easily later and with much simpler SQL statements. Those views may get delted during an update, so that is something to keep in mind, since it is a bit of a hack. If you find that you're missing data, you may want to up your collection interval for the devices or check for WMI connection errors on the servers you are collecting WMI performance data agains from Part-1.
I am going to start by saying some of the tactics in here are likely not Microsoft supported, but they work. Before you make changes, ensure you have the previous settings written down somewhere and your data backed up. While I have not encountered any issues with this procedure, I suppose something could happen that I have not seen in the environments I manage.
There are also a few other ways of accomplishing the report writing, such as using Visual Studio. I wanted to use only free tools that are readily available for this exercise. The driving piece of this is getting access to the performance data. That has been a challenge for myself and many others out there. After this, you will be better prepared to pull a variety of performance metrics from your system in the way you want.
Saban's blog was able to point me to the location of the tables used for the performance data and he uses the Visual Studio method for creating the report. Lot of good information in his blog. Ultimately, I chose a different SQL query method to make it easier (in my opinion) working with the data.
http://skaraaslan.blogspot.com/2011/02/creating-custom-report-for-scom-2007-r2.html
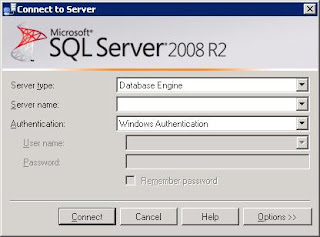
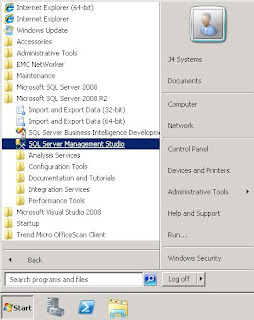
- Go ahead and connect to the SQL server running the OperationsManagerDW database using the SQL Management Studio. If you don't have the SQL management studio on your desktop then you may want to terminal into your database server and connect from there.
- When connecting, enter the SQL server name housing your OperationsManagerDW database.
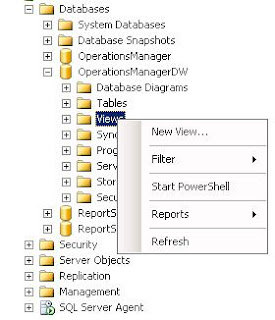
- Once in the SQL Management Studio, browse through the tree to the OperationsManagerDW view tab, where you will right-click on "Views" and select "New View".
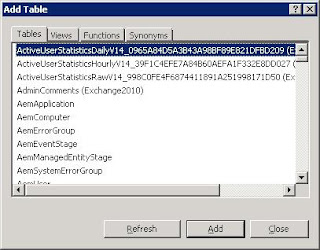
- A box will appear that allows you to grab specific tables or views to add for the query designer. Go ahead and just close this window.
- You will then be presented with a three pane window, the fields should be blank. Post the following SQL statements into the bottom pane (replacing any existing information), after which the view should look like the image following the SQL statements. This view will filter the results to only show the logical disk counters. You could leave the filter out so that you can use this view to poll any performance data. For now, use these statements to only look for LogicalDisk metrics.
- Run the query just to make sure data is getting polled correctly. If not, check to ensure everything has copied and pasted correctly and that the OperationsManagerDW database is selected to run the query against. After the query runs successfully, save the view.
- When the save dialog appears, use the name as shown, as the remainder of this tutorial will be based on this view. Otherwise, remember to change the references to this name with the one you input. The query could also be changed to reflect daily information. Simply go back to the select statement above and change the joins to include Perf.vPerfDaily instead of Perf.vPerfHourly
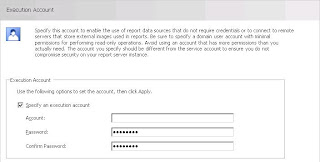
- At this point, we need to make an adjustment to the reporting service. Open the "Reporting Services Configuration Manager" and select the "Execution Account". Take note of the account used here.
- Now open the web management console for the SQL Reporting Server that runs your SCOM reports and select the detailed view in the report manager screen. Look for the Data Warehouse Main data source. Hovering over the entry should bring up a drop down menu, select that and click manage to open the properties of the Data Warehouse Main data connection.
- Go to the "Connect String" properties of the data connector and input the execution account credentials in this spot and save the changes.
- Now you will want to download the Microsoft SQL Server 2008 R2 Report Builder 3.0 software, http://www.microsoft.com/en-us/download/details.aspx?id=6116 (If you do not have SQL 2008 R2 installed, then download Microsoft SQL Server Report Builder 2.0. Report Builder 3.0 only works with SQL 2008 R2)
- Once downloaded and installed, open the report builder and select the "Blank Report" option. You may be promopted for a login to the report server. You should be able to use your local credentials. If those do not work, you may need additional rights to login to the SQL server with your account.
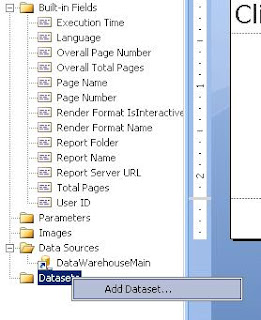
- Once in the "Blank Report", you will need to add a data source. Browse through the tree view on the left and right-click ont he "Data Source" folder to add a Data Source.
- From here you should be able to browse the datasources installed on the report server. The Data Warehouse Main connection should be found by browsing.
- With a datasource setup, you need to now add a dataset to pull the data. Browse the tree 5o "Datasets" and right-click to add a new dataset.
- In the "Dataset Properties", under the "Query" section, input the following code:
- After saving the dataset, you should see the variables for the dataset apear in the left-hand pane.
- In the Report Builder menu at the top, select "Insert" and select the down arrow under "Matrix" to manually insert a matrix table.
- You should be presented with a two row, two column matrix table. Start by dragging the "Path" variable to the lower-left box.
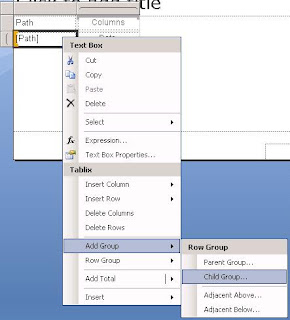
- Now click on the box with the [path] variable, right-click to bring up the context menu and browse down to "Add Group" and select a "Child Group" for the row.
- This will bring up a "Tablix group" dialog box. Select the [InstanceName] variable for this group.
- In the lower-right column, drag the [Total_Disk_Space] Variable to the box. This will want to change the value to the sum of all values. Right-click the field to bring up the expression option.
- Take out the SUM() calculation to leave just the "Total Disk Space" option.
- In the same column, right-click for the context menu and now lets select "Insert Column - Inside Group - > Right". Do this again to add another column.
- Select the top header, right-click for the context menu and select the option to "Split cells". Now you can drag the [Free_Megabytes] variable to the next to last column and the [Used_Space] to the last column.
- Your report should now look something close to this, two rows and five columns, each with unique variables and headers.
- Once you run the report and can see the data, go ahead and save the report directly to the SCOM Report Server. If you select the "My Reports" folder, your report will show in the reports page under "Authored Reports"
SELECT
Perf.vPerfHourly.AverageValue,
dbo.vPerformanceRuleInstance.InstanceName, dbo.vPerformanceRule.ObjectName,
dbo.vPerformanceRule.CounterName, dbo.vPerformanceRuleInstance.LastReceivedDateTime,
Perf.vPerfHourly.DateTime,
dbo.vManagedEntity.DWCreatedDateTime,
dbo.vManagedEntity.ManagedEntityGuid,
dbo.vManagedEntity.ManagedEntityDefaultName,
dbo.vManagedEntity.DisplayName,
dbo.vManagedEntity.Name,
dbo.vManagedEntity.Path,
dbo.vManagedEntity.FullName
FROM
Perf.vPerfHourly INNER JOIN dbo.vPerformanceRuleInstance ON Perf.vPerfHourly.PerformanceRuleInstanceRowId = dbo.vPerformanceRuleInstance.PerformanceRuleInstanceRowId INNER JOIN dbo.vManagedEntity ON Perf.vPerfHourly.ManagedEntityRowId = dbo.vManagedEntity.ManagedEntityRowId INNER JOIN dbo.vPerformanceRule ON dbo.vPerformanceRuleInstance.RuleRowId = dbo.vPerformanceRule.RuleRowId
WHERE (dbo.vPerformanceRule.ObjectName = 'Logicaldisk')
select
[Total Disk Space],
[Free Megabytes],
[Total Disk Space]-[Free Megabytes] AS "Used Space",
InstanceName,
Path,
DateTime from
(
select
CounterName,
AverageValue,
InstanceName,
Path,
DateTime
FROM vCustomHourlyLogicalDiskPerf) AS SourceTable PIVOT ( AVG (AverageValue) FOR CounterName IN ([Total Disk Space],[Free Megabytes])
) AS PivotTable
WHERE
DateTime >= @Start_Date AND
DateTime <= @End_Date AND
NOT InstanceName = '_Total' AND
NOT InstanceName Like '\\?\Volume%%'
Alternatively, if you didn't setup or want to setup the WMI counters for logical disk size, you can extrapolate the information with the following query:
select
[Free Megabytes],[% Free Space],
[Free Megabytes]/([% Free Space]/100) AS "Total Disk Space",
([Free Megabytes]/([% Free Space]/100) - [Free Megabytes]) AS "Used Disk Space",
InstanceName,
Path,
DateTime
from
(select CounterName, AverageValue,InstanceName, Path,DateTime
FROM vCustomHourlyLogicalDiskPerf) AS SourceTable
PIVOT
(
AVG (AverageValue) FOR CounterName IN ([Free Megabytes],[% Free Space])
) AS PivotTable
WHERE
DateTime >= '7/17/2012' AND
DateTime <= '7/18/2012' AND
NOT InstanceName = '_Total' AND
NOT InstanceName Like '\\?\Volume%%' AND
[% Free Space] > 0.000001
This is a super basic, excel like report. In Part-3, we'll take a stab at adding some graphics and formatting the output for Gigabytes, instead of Megabytes, use commas and only two decimal places for the output of the data. By using custom views, you can aggregate a lot of information to query more easily later and with much simpler SQL statements. Those views may get delted during an update, so that is something to keep in mind, since it is a bit of a hack. If you find that you're missing data, you may want to up your collection interval for the devices or check for WMI connection errors on the servers you are collecting WMI performance data agains from Part-1.
Wednesday, July 11, 2012
Setup a Disk Report in SCOM 2012 - (Part 1)
This will start a series of posts related to finally extracting that disk report you've always wanted from SCOM but just couldn't find anywhere, at least not for free. We're going to start with the basics of getting the logical disk size into the datawarehouse so that you can query it later for a SQL report view, or you can use it in the generic report library->performance report or even a workspace performance view. The cool thing with doing it this way is that you can then trend on disk size over time. In a virtual environment, where it is relatively easy to grow a disk, you will be able to go back in time and see when that growth occurred and by how much. That can be a handy report sometimes.
- Start by opening your Microsoft System Center Management Console and navigating to the "Authoring Screen"
- In the "Authoring Screen", right-click on "Rules" and select the "Create a new rule" option
- In the "Create Rule Wizard", expand the "Collection Rules" folder, then the "Performance Based" folder and select "WMI Performance"
- When the rule screen comes up, you'll need to provide a name for the rule and select the target for the rule. Leave the "Rule Category" alone.
- In the "Rule Target" selection screen, change the scope to "View all Targets" and look for "Logical Disk (Server)". Select that and hit "OK" to finish the selection.
- Before proceding, your screen should look something like this.
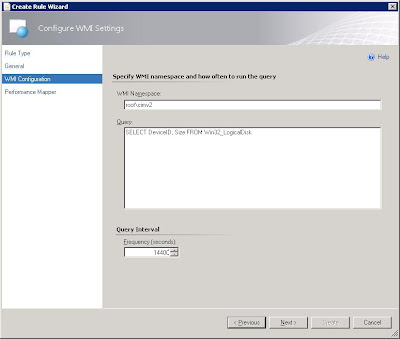
- In the next screen, you'll have to insert your WMI query. For the purposes of this monitor, we really only care about two values, the DeviceID (drive letter) and the Size. That keeps the data returned relatively small to have minimal impact on performance. If you left it as SELECT * and then run the rule, it will bog down SCOM significantly, trust me on that one. Enter how often you want to collect the information. Since total disk size does not change often, you can have a large value here, 14400 would be once every four hours if I have my math right.
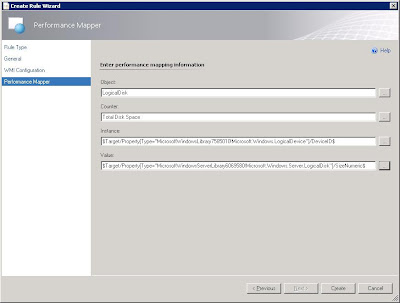
- On the following screen, you'll need to select the values to collect and how the labels should show up when looking for them in the performance monitors. You want the "Object" to be LogicalDisk, this way you can search the datawarehouse for logicaldisk counters and it will show up in the same grouping. This will also allow the value to show up in the same group as your other Logical Disk performance counters elsewhere in the system. You want to give the "Counter" value a name, such as "Total Disk Space" or "Total Disk Size" something to identify this counter as representing the size of the partition in question.
- For the "Instance" Value, let's use the picker, select the "..." on the side and then "Target"
- In the target picker screen, let's pick the "Device Identifier"
- Now let's repeat the process for the "Value" field
- Select the "..." on the side and then "Target"
- In the target picker screen, let's pick the "Size (MBytes) (Numeric)"
- Your Rule Wizard should now look something like this and you are ready to finish the rule. It will initially gather data pretty quickly so you shouldn't have to wait too long before you can go searching for it. This will pick up the space for all logical instances on the Windows servers in your environment.
For the WMI Namespace, enter: root\cimv2
For the Query, enter: SELECT DeviceID,Size FROM Win32_LogicalDisk
In Part 2 of this series, I will outline a SQL query to dump the information in a basic table and a tabular report format, along with other ways to access this information in SCOM. In Part-3, I hope to put together a fancy, graphical report of all the data (we'll see on that one).
Friday, July 6, 2012
Setting up SNMP Monitoring in SCOM 2012 (Part - 2)
**Update, Oct. 30th, 2013. Recently, I have been successfully deploying SCOM without having to also install the native SNMP options in Windows. However, the screens I normally use to validate that SNMP is working did not function correctly. While I was able to generate alerts, the event captures that I show on the last step of this post did NOT function. So, until I am able to get all the features working as I'd like, the steps in this post provide maximum flexibility in SNMP monitoring. I hope, in the future, to perform a side-by-side comparison of what works and does not work based on your installation type. So, you could skip to Step 8 in this guide if you are so inclined and proceed through step 15, but the validation steps after that will likely not work properly.
If you have landed on this page, you are lkely interested in setting up SNMP monitoring for System Center Operations Manager 2012 and have probably been frustrated with the lack of consolidated information or even outdated information found on the Internet. Prepare for a quick and accurate guide to get you trapping SNMP events in no time! I have labeled this Part-2, though there is no Part-1 just yet. I presume that you have taken steps to already discover devices in SNMP and now want to start seeing what type of traps are being generated from those systems. If you haven't been that far yet, let me know and I will post some resources.
First thing is first, despite what you may have read up until now, you still need to have the SNMP service running on the management server that is receiving the traps, do not disable the SNMP service. The TRAP service should be installed but turned off. This contradicts almost every other blog out there but we could not get traps coming in until we turned the service back on, period. Try the enclosed methods first and if you want to toy around, go from there, but I cannot guarantee that you'll be able to get traps if you disable both services. Additionally, to test traps, we setup a basic CentOS system running SNMP. We added the device to SCOM under networking devices. We did not install the LINUX agent.
- Open up the Windows Server Manager, then select Features and on right, select "Add Features"
- Select SNMP Service along with SNMP WMI Provider, you will have to expand to in order to select that additional component.
- Select "Install" and wait for the installation to complete.
- Open services.msc via the run prompt, or through the server manager. Scroll down until you see the SNMP services. Disable the SNMP Trap service as shown.
- Double-click the "SNMP Service" to open the property settings.
- In the SNMP Services Properties window, select the option to "Accept SNMP packets from any host" and then input a community name, such as "public".
- Open the Operations Managre console, select Authoring and then rules. Right-click on Rules in order to create a new rule
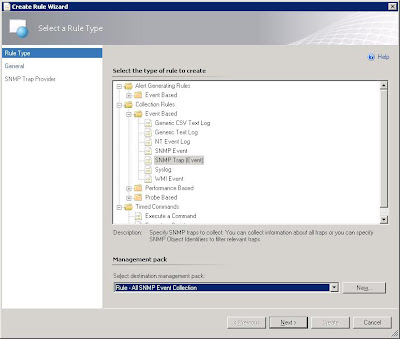
- In the initial Create Rule Wizard, expand "Collection rules"->"Event based" and select the "SNMP Trap (Event)".
- Select to view all targets, then look for node type.
- Your rule should look like this now, a rule name that you have provided, the category of "event collection" and a rule target of "Node".
- For now, you have to input an OID as the screen will not take a blank OID. The one below is generic and can be used for now (1.2.3.4.0).
- Go back to the authoring screen and change the scope to Node so that you can find the newly created rule more easily.
- Right-click and select properties or double-click the new rule you just created.
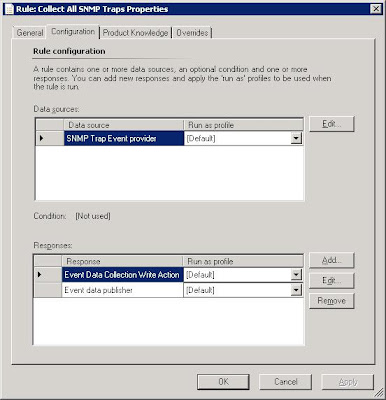
- Under the "Data sources" option, select "Edit".
- Now clear the previously entered OID and select OK.
- Now navigate to the "Monitoring" screen in the Operations Manager Console. Let's create a folder to group our SNMP alerts and collections to make them easy to find. Right-click the top tree labeled "Monitoring" and select "New -> Folder".
- Select the newly created folder and lets add a new event view to that folder.
- Narrow the scope to show data related to "Node" objects.
- For your "Select conditions" show information generated by rules and select the new rule that was created earlier.
- Now, generate a trap. In this case, we're using CentOS 6.2 to generate a simple version 2c SNMP trap to send to the SCOM server.
- If all is well, you should see those traps show up in the SNMP event window.
If you do not see SNMP events showing up, then it is likely your local SNMP service is not functioning correctly or needs to be reinstalled. I will add a couple of great troubleshooting blogs in a few days.
Subscribe to:
Comments (Atom)
