The following link provides the details for the full document. I have enclosed the basic text here as well.
https://docs.google.com/document/d/1eSwu81QxGhkRIfua-OBv3XPKXuP4PwD_WfEXv8wYFX4/edit
Document Overview Information
This document contanins step-by-step instructions on how to
monitor devices via SysLog alerting through Microsoft System Center Operations
Manager 2012. The purpose of the document is to fully setup and test SysLog
alerting for your network or server devices. This document will be periodically
updated with methods to enable syslogging on systems such as VMWare, F5 and
other devices.
Presumptions
This document presumes the user already has a number of
devices discovered within System Center. If feedback requests that the document
cover how to add an SNMP device or network equipment, then that may eventually
be included.
References
The following sources provided valuable information for this
whitepaper:
Essentially, when setting up SysLogging for Operations
Manager, you are setting up a global monitoring parameter, meaning a single
rule will alert for multiple devices. You could create groups and add some
custom information to get more granular with the alerts, such as whether the
alerts were coming from a network device, server, VMWare environment or
Windows. We’ll explore that further in future document versions. For now, the
document presumes you want to get SysLogging up as quickly as possible to
interface with as many devices as possible.
SCOM SysLog Variables
As mentioned in Clive Eastwoods blog posting, there are a
number of variables that you can add to the alerts to help identify the source.
These variables are as follows:
$Data/EventData/DataItem/Facility$
$Data/EventData/DataItem/Severity$
$Data/EventData/DataItem/Priority$
$Data/EventData/DataItem/PriorityName$
$Data/EventData/DataItem/TimeStamp$
$Data/EventData/DataItem/HostName$
$Data/EventData/DataItem/Message$
Syslog categorizes alerts from various system components
through facility names. These facility names generally correspond to the operating
level of the system component, zero or zero ring being the kernel in most
systems and then moving up the chain from there. Enclosed is a full table of
the SysLog Facility names:
<><>
<><>
<><>
Facility Number
| <><>
Facility Description
| <><>
<><>
<><>
0
| <><>
kernel messages
| <><>
<><>
<><>
1
| <><>
user-level messages
| <><>
<><>
<><>
2
| <><>
mail system
| <><>
<><>
<><>
3
| <><>
system daemons
| <><>
<><>
<><>
4
| <><>
security/authorization messages
| <><>
<><>
<><>
5
| <><>
messages generated internally by syslogd
| <><>
<><>
<><>
6
| <><>
line printer subsystem
| <><>
<><>
<><>
7
| <><>
network news subsystem
| <><>
<><>
<><>
8
| <><>
UUCP subsystem
| <><>
<><>
<><>
9
| <><>
clock daemon
| <><>
<><>
<><>
10
| <><>
security/authorization messages
| <><>
<><>
<><>
11
| <><>
FTP daemon
| <><>
<><>
<><>
12
| <><>
NTP subsystem
| <><>
<><>
<><>
13
| <><>
log audit
| <><>
<><>
<><>
14
| <><>
log alert
| <><>
<><>
<><>
15
| <><>
clock daemon
| <><>
<><>
<><>
16
| <><>
local use 0 (local0)
| <><>
<><>
<><>
17
| <><>
local use 1 (local1)
| <><>
<><>
<><>
18
| <><>
local use 2 (local2)
| <><>
<><>
<><>
19
| <><>
local use 3 (local3)
| <><>
<><>
<><>
20
| <><>
local use 4 (local4)
| <><>
<><>
<><>
21
| <><>
local use 5 (local5)
| <><>
<><>
<><>
22
| <><>
local use 6 (local6)
| <><>
<><>
<><>
23
| <><>
local use 7 (local7)
| <><>
<><>
In addition to monitoring which system area is generating
the alert, the SysLog service will assign a criticality to the alert. These can
be used to setup additional rules and views within SCOM, which will be covered
in another section. The severity levels are described as follows (source
wikipedia.org - http://en.wikipedia.org/wiki/Syslog):
<><>
<><>
<><>
Code
| <><>
Severity
| <><>
Description
| <><>
General Description
| <><>
<><>
<><>
0
| <><>
Emergency
| <><>
System is unusable.
| <><>
A "panic"
condition usually affecting multiple apps/servers/sites. At this level it
would usually notify all tech staff on call.
| <><>
<><>
<><>
1
| <><>
Alert
| <><>
Action must be taken
immediately.
| <><>
Should be corrected
immediately, therefore notify staff who can fix the problem. An example would
be the loss of a backup ISP connection.
| <><>
<><>
<><>
2
| <><>
Critical
| <><>
Critical conditions.
| <><>
Should be corrected
immediately, but indicates failure in a primary system, an example is a loss
of primary ISP connection.
| <><>
<><>
<><>
3
| <><>
Error
| <><>
Error conditions.
| <><>
Non-urgent failures,
these should be relayed to developers or admins; each item must be resolved
within a given time.
| <><>
<><>
<><>
4
| <><>
Warning
| <><>
Warning conditions.
| <><>
Warning messages,
not an error, but indication that an error will occur if action is not taken,
e.g. file system 85% full - each item must be resolved within a given time.
| <><>
<><>
<><>
5
| <><>
Notice
| <><>
Normal but
significant condition.
| <><>
Events that are
unusual but not error conditions - might be summarized in an email to
developers or admins to spot potential problems - no immediate action
required.
| <><>
<><>
<><>
6
| <><>
Informational
| <><>
Informational
messages.
| <><>
Normal operational
messages - may be harvested for reporting, measuring throughput, etc. - no
action required.
| <><>
<><>
<><>
7
| <><>
Debug
| <><>
Debug-level
messages.
| <><>
Info useful to
developers for debugging the application, not useful during operations.
| <><>
<><>
Now that we have the variables for the alerts along with the
system facilities and severity levels to use, we can jump in to setup
SysLogging!
Some quick background, if you want to use custom device
groups for controlling your syslog alerts, the management pack that has the
group will have to be used for setting up the alert rules as well. For this
reason, I suggest setting up a management pack for syslog rules and monitors as
well as device groups. This ensures you will be able to select those groups
during the rule setup. Otherwise, groups outside of the management pack that
are in unsealed management packs (i.e. ones that you have created already) will
not be available.
1.
Open the Operations Manager Management Console, Select Authoring
2.
Select “Groups” and then “Create a New Group”
a.
For the group name, put in something such as “SysLog
Devices”
b.
When selecting your management pack, I suggest creating
a new management pack dedicated to syslog, label the management pack SysLog Monitoring
or something to that effect so you know it has to do with the SysLog services.
c.
For explicit members, add the SNMP devices or Windows
Hosts you might want to process.
4.
Right-click on Rules and select “Create a New Rule”
5.
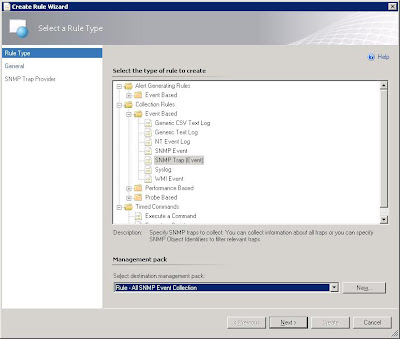
Select “Event Based” under the “Alert Generating Rules”
and then select “Syslog (Alert)”. Select the management pack you setup earlier
for SysLog alerts and groups.
6.
We will label this rule name as “Syslog Kernel Alerts
(Critical)”
7.
Rule category will be “Alert”
8.
For the “Rule Target”, select the group you setup for
syslog devices.
9.
In the “Build Event Expression” screen, select the
“Insert” dropdown and select an “And Group”
10.
In the first field, under “Parameter Name” type in
“Facility” (Without the quotes), “Operator” should be “Equals” and the “Value”
should be “0” (zero)
11.
Simple hit “Insert” to add another row. Under the
“Parameter Name” type in “Severity”, “Operator” should be “Equals” and the
“Value” should be “2”
12.
On the “Configure Alerts” screen, you can alert the fields
you want to include. I typically include all the variables allowed. If you were
grouping devices, you could also include a descriptor here to show what the
group was, such as routers, switches, servers, etc. Enclosed are the variables
we use.
Event Description:
$Data[Default='']/EventDescription$
Facility:
$Data/EventData/DataItem/Facility$
Severity:
$Data/EventData/DataItem/Severity$
Priority:
$Data/EventData/DataItem/Priority$
Priority Name:
$Data/EventData/DataItem/PriorityName$
Time Stamp: $Data/EventData/DataItem/TimeStamp$
Host Name:
$Data/EventData/DataItem/HostName$
Error Message: $Data/EventData/DataItem/Message$
Once the alert has been created, you may
want to go back to the alert and configure the suppression fields, this way, a repeating
alert from a system won’t flood your monitoring dashboard.
a.
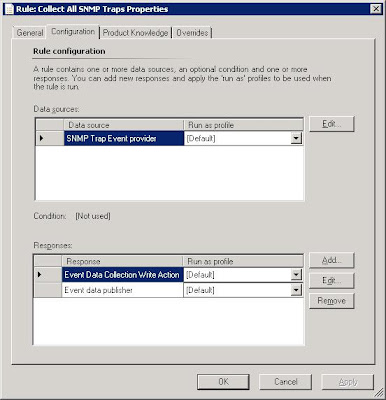
To do this, go to the Rules section and double-click on
your new alert.
b.
Select the “Configuration” tab and then “Edit” under
the “Responses” section.
c.
On the next screen, select the “Alert Suppression”
d.
You can play around with the options here. The ones
checked in this example usually work well to start.
This section outlines methods that can be used to test
SysLog alerts.
1.
First step is to download the Kiwi Syslog Message
Generator –
2.
After installing the Syslog message generator, select
the options to match the alert conditions, in this case, a Facility of “Kernel”
and Severity of “Critical”. The priority is not used in this case and can be
any number. The target IP will be the SCOM Management Server.
3.
The SysLog Alert should now show up in the management
console.
This process can be repeated by using different
severity levels and facilities. For
example, if you want to have one rule that can alert for all critical severity
levels, the you could setup a rule to look for severity 0,1 or 2 along with the
kernel facility. The rule use an AND statement to include the facility level, then an or statement along wtih multiple expressions for the severity level.


