Search This Blog

Tuesday, December 23, 2014

AD Site Availability Degraded / AD Site Performance Health Degraded

After deploying the Active Directory Management Packs, we had a domain controller start alert spewing. I had not come across anything out there that really dealt with the alert; the warning from this type of event was not in eventid.net either. But it's all figured out now and here is the solution to the perplexing problem I encountered.

You could also title this, "How to Perform an Online/Offline Defragmentation of your Health Service Store in System Center".

Problem Description:

First, the SCOM console began to fill up with AD Site Availability Health Degraded and AD Site Performance Health Degraded critical alerts from the Active Directory Management Packs.

AD Site Availability Health Degraded and AD Site Performance Health Degraded

On the offending domain controller, I observed the following Application event log spewing:


The contents of the warning were as follows:
HealthService (1704) A significant portion of the database buffer cache has been written out to the system paging file. This may result in severe performance degredation. See help link for complete details of possible causes. Log Name: Application | Source: ESENT | Event ID: 906

Troubleshooting:

Initially what I suspected was that I had an application or process going bonkers on the server, taking up memory and causing the SCOM agent to malfunction or be starved of resources. I loaded the Systernals Process Monitor utility to see what was happening when these events fired off, since typically it only took a few minutes in between each event. What was captured was a significant amount of file activity from the Health Service to
C:\Program Files\Microsoft Monitoring Agent\Agent\Health Service State\Health Service Store\HealthServiceStore.edb . Essentially, there was no other process at the time of these warnings or corresponding alerts in the System Center Management Console that could account for issues on the system.
 
 
SCOM HealthService | ReadFile | C:\Program Files\Microsoft Monitoring Agent\Agent\Health Service State\Health Service Store\HealthServiceStore.edb
 
With the smoking gun being the Health Service Database, I performed some quick online maintenance from within the console to start.
 
In the Operations Manager Console, I started by browsing to the Operations Manager folder, then Agent Details and selecting the Agents by Version view.
Management Console Tree -> Operations Manager -> Agent Details -> Agents By Version
 
 
Selecting the offending computer brought up the Health Service Tasks I could perform, Start Online Store Maintenance, being the one I was looking for.
Management Console Health Service Task for Health Service Database Maintenance | Start Online Store Maintenance
 
Final Solution:

Unfortunately, the online store maintenance was not adequate enough to remediate the errors and warnings I was encountering so I opted for an offline defragmentation of the Health Service Store database. Perform the following if local warnings persist on the client system.
 
  • Login to the offending client system via console or RDP
  • Open an administrative command prompt
  • Change directory to "C:\Program Files\Microsoft Monitoring Agent\Agent\Health Service State\Health Service Store"
  • From the service console (services.msc) or from command prompt (net stop “Microsoft Monitoring Agent”), stop the Microsoft Monitoring Agent service
  • Run esentutl /r edb (without this, you likely won't be able to perform a defragmentation)
  • Next, run esentutl /d HealthServiceStore.edb
Running esentutl /d HealthServiceStore.edb in order to compact and defragment the health service database after log spewing occurred from loading the Active Directory management packs

When this completed, my HealthServiceStore.edb file went from 174MB to 27Mb and both the warnings in the local Application event log and the critical health alerts in the System Center Operations Manager Console went away.

Wednesday, August 6, 2014

Problems with the 2012 R2 Web Consoles

This post is a little long, but I wanted to include as much pertinent error information as possible to help folks properly identify if they are encountering the same type of issue.

Recently upgraded our systems to SCOM 2012 R2 and encountered some issues with client connectivity to the web console. SQL is on a separate system from the management console. Web and Management Console is on the same system (for perspective on how our systems are distributed).

First, let's start with some of the errors I was seeing:

From a client, attempting to connect to the AppAdvisor console:

Error on the client:

An error has occured - The additional error information can be found int he Windows Application Log. We appologize for any inconvenience caused by this temporary service outage.


Warning on the SCOM management server when connecting to the AppAdvisor console:

Event code: 3005 Event message: An unhandled exception has occurred. Event time: 8/5/2014 9:38:10 AM :
Event time (UTC): 8/5/2014 4:38:10 PM :
Event ID: 20964fc40f3c43348ccff13e467e259a :
Event sequence: 7 :
Event occurrence: 1 :
Event detail code: 0 :
:
Application information: :
Application domain: /LM/W3SVC/1/ROOT/AppAdvisor-1-130517302775480349 :
Trust level: Full :
Application Virtual Path: /AppAdvisor :
Application Path: C:\Program Files\Microsoft System Center 2012 R2\Operations Manager\WebConsole\AppDiagnostics\AppAdvisor\Web\ :
Machine name: SCOM-MS01 :
:
Process information: :
Process ID: 4332 :
Process name: w3wp.exe :
Account name: NT AUTHORITY\NETWORK SERVICE :
:
Exception information: :
: Exception type: WebException :
Exception message: The request failed with HTTP status 401: Unauthorized.:
:
Request information: :
Request URL: http://scom-ms01/AppAdvisor/Pages/ReportService/ReportServicePageImpl.aspx?_r=&_c=g&_pg=436ac5a4-3e70-41b9-9fe1-5a5c96724dc0&_s=2C369460 :
Request path: /AppAdvisor/Pages/ReportService/ReportServicePageImpl.aspx :
User host address: :
User: :
Is authenticated: True :
Authentication Type: Forms :
Thread account name: NT AUTHORITY\NETWORK SERVICE :
:
Thread information: :
Thread ID: 17 :
Thread account name: NT AUTHORITY\NETWORK SERVICE :
Is impersonating: False :

Similarly, I received that error when connecting to the AppDiagnostics site as well:

Event code: 3005
Event message: An unhandled exception has occurred.
Event time: 8/5/2014 9:32:02 AM
Event time (UTC): 8/5/2014 4:32:02 PM
Event ID: 67e2d2ba9c4842c3bc041c62bad932e3
Event sequence: 8
Event occurrence: 1
Event detail code: 0
Application information:
Application domain: /LM/W3SVC/1/ROOT/AppDiagnostics-2-130517299136496487
Trust level: Full
Application Virtual Path: /AppDiagnostics
Application Path: C:\Program Files\Microsoft System Center 2012 R2\Operations Manager\WebConsole\AppDiagnostics\Web\
Machine name: SCOM-MS01

Process information:
Process ID: 8048
Process name: w3wp.exe
Account name: IIS APPPOOL\OperationsManagerAppMonitoring

Exception information:
Exception type: OleDbCommandException
Exception message: Login failed for user 'NT AUTHORITY\ANONYMOUS LOGON'.
Command text: Select CONFIGID, CONFIGNAME, CONFIGVALUE From apm.CONFIG
Connection: Provider=SQLOLEDB;Server=scom-sql;database=OperationsManager;Integrated Security=SSPI;

Request information:
Request URL: http://scom-ms01/AppDiagnostics/Pages/Authenticate.aspx?ReturnUrl=/appdiagnostics
Request path: /AppDiagnostics/Pages/Authenticate.aspx
User host address:
User:
Is authenticated: False
Authentication Type:
Thread account name: IIS APPPOOL\OperationsManagerAppMonitoring

Thread information:
Thread ID: 9
Thread account name: IIS APPPOOL\OperationsManagerAppMonitoring
Is impersonating: False

And finally, on the primary /OperationsManager web console, I'd receive an authentication error. The client would be prompted multiple times for a username and password and eventually bomb out.

 
Server Error - 401 - Unauthorized: Access is denied due to invalide credentials. You do not have permission to view this directory or page using the credentials that you supplied.
 
Solving the problem.

First step was a prerequisite for both the AppAdvisor and AppDiagnostic issues.
  1. Open the IIS console on the web console server
  2. Select "Application Pools"
  3. Select "OperationsManagerAppMonitoring"
  4. If you are receiving the errors and the application pool "Identity" is set to "ApplicationPoolIdentity", with the OperationsManagerAppMonitoring pool highlighted, select "Advanced Settings" option in the action pane.
  5. Under "Process Model", change the Identity from ApplicationPoolIdentity to "NetworkService"
  6. Run an IISReset at an administrator (elevated) command prompt
At this point, the AppDiagnostic website started working, but the AppAdvisor site did not. I had to perform additional steps for that site.
  1. Open the IIS console on the web console server
  2. Select and expand the site (Default Web Site on my server) where the Operations Manager web console is installed.
  3. Select the virtual directory named "AppAdvisor"
  4. Open the "Authentication" applet
  5. If not already enabled, enable the "Anonymous" and "ASP .NET Impersonation" methods
  6. Run an IISReset at an administrator (elevated) command prompt
Final piece to get into the Operations Manager web console was to adjust an IE setting, oddly enough. To fix this portion, I took the following steps:
  1. Open "Internet Options" in Internet Explorer
  2. Select the "Advanced" tab
  3. Scroll almost all the way down and uncheck the box for "Enable Integrated Windows Authentication"
After these adjustments, all web consoles were available for remote clients.

Friday, February 7, 2014

SCOM 2012 Failed Accessing Windows Event Log with Veeam Management Pack

Noticed during a routine health check that our two Management Servers were showing a warning state. Error read as "Failed Access Windows Event Log" <management server 1> (Health Service).

Error details show the following:

The Windows Event Log Provider is still unable to open the Veeam Collector event log on computer 'management server 1'. The Provider has been unable to open the Veeam Collector event log for 720 seconds. Most recent error details: The specified channel could not be found. Check channel configuration. One or more workflows were affected by this. Workflow name: many Instance name: many Instance ID: many Management group:

We have the Veeam management pack for SCOM loaded and sure enough, this appears to be a documented issue on the Veeam knowledge base.

http://www.veeam.com/kb1496#/kb1496

Thursday, November 21, 2013

Windows 2012 WMI Hotfix

Had a 2012 Server that was being monitoring by System Center lock up on us today. Suspect a WMI leak. Hotfix deployment, engage!

http://support.microsoft.com/kb/2790831/en-us

Friday, November 15, 2013

SCOM 2012 Powershell - Retrieving a List of Computers in a Group

Had to search for a batch file that is on one of the many SQL servers we have in the environment. First inclination was, let me pull the systems from SCOM since it has all our SQL servers.

Poked around the interwebs a while and noticed a lot of scripts had references to 2007 commands that hadn't been updated to 2012. Here's the basic steps taken to get my group of SQL servers. You could perform the same task on pretty much any group in the same manner.

  • Open the Operations Manager Shell powershell console

Image illustratin the correct System Center 2012 Operations Manager Shell to open for running the powershell commands
  • Type in : Get-SCOMGroup
Image shows the sample output of running the SCOM 2012 Get-SCOMGroup command in powershell
  • Search for the group you want to retrieve members from
  • Now type in: $Group = Get-SCOMGroup |  where {$_.DisplayName -eq "SQL Computers"} (or insert the group your looking for instead of SQL Computers")
Image illustrates running the Get-SCOMGroup command with a filter for a specific group and assigning to a variable

  • Next, type in: $Members = $Group.GetRelatedMonitoringObjects()
 
Illustrates the use of the command GetRelatedMonitoringObjects() for retriving a list of group members and assigning them to a variable

  • Now, you can simply type: $Members
 
Illustrates the output of members captured in the previous step using GetRelatedMonitoringObject(). Should show three headings and then the server members from the group

  • Or, pipe the command out to a file: $Members | Sort DisplayName | FT DisplayName | out-file C:\Scripts\Servers.txt
 
Illustrates running the following command in powershell to pipe a variable out to a file: $Members | Sort DisplayName | FT DisplayName | out-file C:\Scripts\Servers.txt


Thursday, October 31, 2013

Automated Discovery and Troubleshooting of Gray State Systems in System Center 2012 (Part-1)

Recently come across a rash of clients and internal systems at the office where monitored devices, for whatever reason, have gone into a gray state. I needed a way to quickly discover these systems, and ideally, run a script that would take some basic actions to remediate or troubleshoot these agents. In this first post, I'll give the full code necessary to get the gray agent discovery running. In the second post, I'll give a powershell script that detects the grayed out agents, shuts down the HealthService, clears the agent health directory, and then turns the HealthService back on automatically.

I came across three lines of code in the following blog, which got me pointed in the right direction. However, the code did not work correctly as provided.

http://www.bictt.com/blogs/bictt.php/2011/05/27/scom-trick-14-troubleshoot-grey

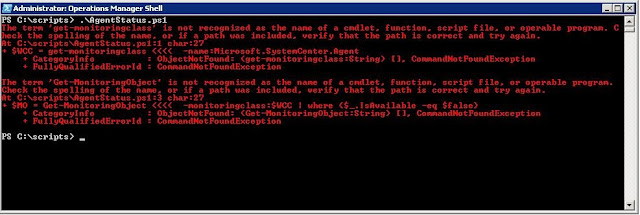
$WCC = get-monitoringclass -name "Microsoft.SystemCenter.Agent"
$MO = Get-MonitoringObject -monitoringclass:$WCC | where {$_.IsAvailable -eq $false}
$MO | select DisplayName


With just that code, I would receive the following error screen:

Illustrates an error that is common when using powerhsell get-monitoringclass without specifiying the appropriate variables for the script to connect to the System Center 2012 Management Server


If you update the code to include the following path and connection to your system center server, the code will function properly. Running this should spit out a list of computers with a gray state in the agent status. This code should all be included in your powershell script:


$RMSFQDN = "<your SCOM managment server FQDN>"
$Name = "Microsoft.EnterpriseManagement.OperationsManager.Client"
$ModuleLoaded = Get-Pssnapin $Name -ErrorAction SilentlyContinue

If (-not $ModuleLoaded)
{
add-pssnapin "Microsoft.EnterpriseManagement.OperationsManager.Client";
}

New-ManagementGroupConnection -ConnectionString $RMSFQDN
Set-Location "OperationsManagerMonitoring::";


$AgentClass = get-monitoringclass -name:Microsoft.SystemCenter.Agent
$MO = Get-MonitoringObject -monitoringclass:$AgentClass | where {$_.IsAvailable -eq $false}

$MO | select DisplayName


Also, review this link for a comprehensive list of WMI hotfixes for various platforms:

http://support.microsoft.com/kb/2591403

Updated 11-15-2013: Review this link for agent based system hotfixes: http://support.microsoft.com/kb/2843219

Friday, June 14, 2013

Scripting the Deployment of the Action Account to servers

If you have a large server list and you quickly want to add rights for your action account, check out this helpful method. Just go to active directory and create a query for your servers, then remove the columns (outside of the server names). I've enclosed the query definition. Drop this into an xml file and import into Active Directory, under "Saved Queries".

<QUERY><NAME>Servers</NAME><DESCRIPTION></DESCRIPTION><DN></DN><FILTERLASTLOGON>-1</FILTERLASTLOGON><LDAPQUERY>(&amp;(&amp;(sAMAccountType=805306369)(objectCategory=computer)(objectClass=computer)(operatingSystem=Windows\20Server*)))</LDAPQUERY><ONELEVEL>FALSE</ONELEVEL><COLUMNID>{5AAC0BFD-BFA4-44BB-95A9-EF6CCC1F64EF}</COLUMNID></QUERY>
Here is the link to the site:

http://www.bluemoonpcrepair.com/wp/?p=145